
Contact
 +49 9131 85 27826
 +49 9131 85 27270

Address
Chair of Computer Science 5 (Pattern Recognition)
Martensstrasse 3
91058 Erlangen
Germany
Powered by


Dr.-Ing. Firas Mualla
Alumnus of the Pattern Recognition Lab of the Friedrich-Alexander-Universität Erlangen-Nürnberg
Research interests
Machine learning-based image analysis
Bright-field microscope images
Cell detection and segmentation
Cell classification and vitality detection
Cell density estimation in overpopulated cell images
Transport of intensity equation and phase retrieval
Current research
Through growing of cell cultures, observing the morphological development of cells and the chemical properties of cultivation media, biologists can draw conclusions which are relevant in a wide range of applications. These applications include, but not limited to: Toxicity tests, virology, vaccine production, cancer research, and gene therapy. We use state of the art techniques in computer vision and machine learning in order to make the life of biologists easier and at the same time pushing the research forward in medicine and biotechnology. Our work in this area is in the context of the interdisciplinary research project COSIR(German).
-
Cell detection pipeline 
Cell detection in bright-field microscope images is a challenging task due to the low contrast delivered by the simple bright-field hardware. In addition, cells usually show a great diversity in size, orientation, and visual appearance. In order to cope with these difficulties, we developed a learning-based system for cell detection. It was designed with the following goals in mind: First, invariance to cell size, cell orientation, and illumination conditions. Second, the system should make no prior assumptions about cell shape. Third, no manual tuning of the system parameters is required. Fourth, the result of detection should be well-suited for tracking. The latter is particularly important for time-lapse microscopy.
The algorithm pipeline is shown in the figure: (A) A defocused image is used as input. (B) Scale invariant feature transform (SIFT) is applied. (C) Features are extracted for each SIFT keypoint and fed into a random forest classifier in order to classify the keypoints into cell and background. (D) Background keypoints are discarded and intensity profiles are extracted between each two “nearby” keypoints. (E) Features are extracted for each profile and fed into another random forest classifier in order to classify the profiles into “inner” and “cross” profiles. Any profile between two keypoints in the same cell is called inner profile, otherwise it is called cross profile. (F) The result of the previous classification step is probabilistic. The probability that a profile between two keypoints is an inner profile is considered as a similarity measure between these two keypoints. The matrix of similarity measure values for all cell keypoints is used as input for agglomerative hierarchical clustering. A customized linkage method was developed and used for the clustering in order to incorporate application-specific information. (G) A weighted average of the keypoint coordinates inside each cluster is computed and considered as a cell center.
The keypoint features and the profile features were carefully designed in order to make them, as far as possible, invariant to scale, orientation, and illumination conditions.
The evaluation database contained more than 3500 manually labeled cells in three real cell lines and 30000 cells in two simulated cell lines. The detection error was in the best case close to zero, and in the worst case less than 15%.
The algorithm was developed for and evaluated on bright-field microscope images. However, due to its general design, we also used it for molecule detection in scanning tunneling microscope images.
Source code: coming soon.
Journal ArticlesIEEE Transactions on Medical Imaging, vol. 32, no. 12, pp. 2274-2286, 2013 (BiBTeX, Who cited this?)
-
We created a database of five cell lines in order to assess the performance of cell detection algorithms. The figure shows ROIs extracted from each cell line: (A) CHO adherent cells at defocus distance 30 µm. (B) L929 adherent cells at defocus distance 30 µm. (C) Sf21 suspension cells at defocus distance 15 µm. (D) Cells simulated using [1] with SNR = 63. (E) Cells simulated using [1] with SNR = 0.07.
The ground truth of the simulated cells was obtained from the simulation software. The real cells were labeled by two bioprocess engineering experts using LabelMe [2]. The labeling was done by manual delineation of cell borders. In total, the database contains more than 3500 manually labeled cells and 30000 simulated cells.
We highly appreciate the efforts of our partners in the Institute of Bioprocess Engineering, Friedrich-Alexander-University, Erlangen-Nuremberg, especially Mr. Björn Sommerfeldt, for their efforts in image acquisition, cell culturing, and cell annotation.
[1] A. Lehmussola, P. Ruusuvuori, J. Selinummi, H. Huttunen, and O. Yli-Harja, “Computational framework for simulating fluorescence microscope images with cell populations,” IEEE Transactions on Medical Imaging, vol. 26, no. 7, pp. 1010 –1016, July 2007.
[2] B. Russell, A. Torralba, K. Murphy, and W. Freeman, “Labelme: A database and web-based tool for image annotation,” International Journal of Computer Vision, vol. 77, no. 1, pp. 157–173, May 2008.
(A) CHO adherent 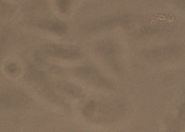
(B) L929 adherent 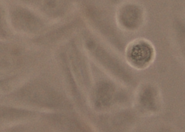
(C) Sf21 suspension 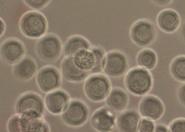
(D) Simulated, SNR = 63 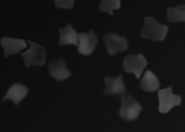
(E) Simulated, SNR = 0.07 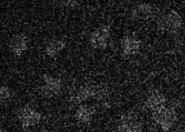 Journal ArticlesIEEE Transactions on Medical Imaging, vol. 32, no. 12, pp. 2274-2286, 2013 (BiBTeX, Who cited this?)
-
(A) Cross sections along the medial axis. 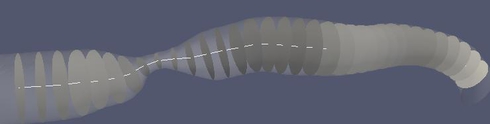
(B) Circumference curvature as a stenosis feature. The branch is approximately 25 mm long. The minimum of the minimum diameters is 0.24 mm. The derivative scale is 1 mm. 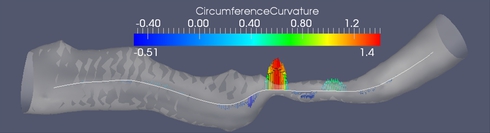
(C) Sammon map of the stenosis feature space. 
In this work we propose a set of features for stenosis classification. The proposed processing pipeline starts with segmenting a digital subtraction angiography (DSA) volume using a level set segmentation framework. The resulting mask M is skeletonized using a distance-transform based skeletonization method. The skeleton tree is then traced and segmented into branches. Bifurcation points are detected and excluded from further processing because the morphology of vascular trees inside bifurcations is inherently different from the morphology inside branches. At each medial axis point, whose distance to the closest bifurcation is above a certain threshold, a cross-section of the binary mask M is extracted perpendicular to the medial axis (figure (A)). Then a feature vector is extracted and fed into a support vector machine (SVM) in order to classify the point as belonging to a healthy or a stenotic branch.
Figure (B) shows one of the stenosis features which proved to be discriminative between stenotic and healthy medial axis points. It is the second derivative of the cross-section's circumference as a function of the abscissa along the medial axis.
The evaluation was performed on 12 healthy and 4 stenotic branches extracted from 6 DSA volumes. In addition, 7 simulated stenotic branches were used. In total, the dataset contained 23 branches. The simulated branches were investigated by a medical doctor and given an average grade of 65 % in terms of similarity to natural stenoses. The total number of feature vectors extracted from all branches was 189 stenotic feature vectors and 3087 healthy feature vector. Figure (C) shows a Sammon map projection of this feature space. In order to cope with data imbalance, a control-sensitivity SVM model was used. In a leave-one-branch-out cross validation, the misclassification rate was 6.7 % of the feature vectors using a radial basis function kernel and 6.4 % using a linear kernel.
Journal ArticlesPhysics in Medicine and Biology, vol. 57, no. 9, pp. 2555-2573, 2012 (BiBTeX, Who cited this?)
-
In this work, we borrowed a law from fluid dynamics and used it for detection of vascular diseases.
Murray’s law states that at each branch point of a lumen-based system, the sum of minor branch diameters each raised to a power x, is equal to the main branch diameter raised to the power x. The principle of minimum work and other factors like vessel type, impose typical values for the junction exponent x. Therefore, deviations from these typical values may signal pathological cases. This medical use of Murray’s law was already suggested in literature. Our contribution was the following:
We stated the necessary and sufficient conditions for the existence and uniqueness of the solution for x. In fact, we solved Murray’s equation for the junction exponent x as an optimization problem. The optimization problem was formulated as finding x which minimizes the squared difference of the two sides of Murray's law under the condition x > 0. We proved that the optimization problem and the equation are equivalent only when the diameters configuration is not degenerate. By a degenerate diameters configuration we mean that at least one minor diameter is larger than the main diameter. This could be the case, for example, if the main branch contains a long narrowing or if a minor branch contains an aneurysm. Basically three cases were found and mathematically proved. First, if the case is not degenerate, then there is an existent and unique solution of the equation. Second, if the case is degenerate but the geometric mean of the minor diameters is still less than the main diameter. In this case, there is no solution of Murray’s equation, but there is an existent and unique solution of the optimization problem. Third, if the case is degenerate with the geometric mean of the minor branch diameters larger than the main branch diameter. In this case, there is no solution, i.e. no optimal junction exponent exists.
The figure shows a 3D model built from a segmented cerebral DSA volume. In (1), the mean diameter of each branch is shown. It is the mean of the mean diameters of all cross-sections of the branch. In (2), the junction exponent x is shown. In (3), the residual of the optimization problem is shown. Bifurcation A contains an aneurysm in its right minor branch. The branches related to bifurcation B do not contain rapid surface changes like stenoses or aneurysms, but the main branch is narrower than one of the minor branches (the degenerate case). Both the junction exponent and the residual are distinguishable at A and B.
(1) The mean cross-section diameters are averaged in each branch. 
(2) The junction exponent at each bifurcation. The arrows represent the directions which define the main/minor branches. 
(3) The optimization problem residual at each bifurcation.  Journal ArticlesPhysics in Medicine and Biology, vol. 57, no. 9, pp. 2555-2573, 2012 (BiBTeX, Who cited this?)